Radar Signal Trading System
HDFC, Tester
Every trader wishes to pick the best stock out of the lot – the stock which will give exceptional returns continually. It can be quite difficult to fish out that particular stock with just a look. Experienced traders often prefer going through historic data to assess a stock’s potential. However, it can be difficult to sift through the massive amount of data available across the internet. The task becomes even harder when one realizes that the useful data is hidden under a pile of worthless data.
Furthermore, there are hundreds and thousands of stocks listed on the national stock exchanges. It may not be feasible for the traders to track all the stock exchanges on their own. Fortunately, RADAR can help a trader zero down on the stocks that suit the trader’s investing style and strategy.
What is RADAR?
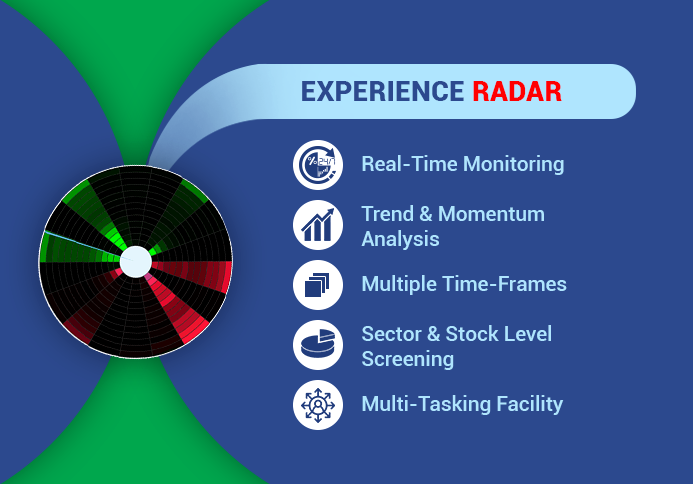
RADAR is a visual representation of Screener events. RADAR helps traders understand the visual occurrence of events when a stock price moves up or down. Visual cues help us find a pattern in the movement of a security and take a position in the security. RADAR is an effective stock filter which limits exposure to only those stocks which meet the investors’ parameters. The parameters are unique as they’re set by the traders themselves.
How to interpret RADAR?
When the market is in a Bullish or Bearish trend, the opening is very important. A trader normally tries to understand how many stocks opened, up or below as compared to yesterday’s close price. RADAR helps trader understand how many stocks have Gap Up, Gap Down, Filled Gap Up, Filled Gap Down openings. In the case of the majority on either side, it is easy to gauge the trend continuity.
The next step after market opening is to understand the ongoing momentum and it is very important to know how many stocks are Breaking Resistance or Support Levels. Majority of Stocks Breaking Resistance Level 1 followed by Resistance Level 2 show a bullish momentum and vice-versa. RADAR helps you understand this scenario at any point in time. This is very useful in momentum trading. When the market is very volatile, e.g. most of the stocks are at Support 3, 60%-80% time we have a small bounce back or retrenchment Resistance case.
Suppose we have a great session in Market where we have Gap Up Openings, followed by Securities breaking Resistance level. To determine whether the trend has legs to go far, the Vol > Prev Day’s Vol with Price Gain is a great indicator to verify the trend. RADAR gives you supporting data like 52 Week along with Day’s High and Breaking Resistance that shows the ongoing momentum.
At the individual stock level, RADAR helps traders identify the path in which the security has traversed. Traders can analyze the market by using three different time intervals – 15min, 30min, and 60min. The universe of stocks can also be changed depending on the trader’s choice.
Overview
RADAR’s screener allows investors to research potential investment ideas. The investment ideas presented are based on the various level of technical analysis. With RADAR, traders can analyze multiple stocks in a short period of time. The tool presents historic and real-time data to help project a particular stock’s’ future performance.
RADAR is an Exclusive Feature in our Advanced Trading Platform ProTerminal

Related Posts
Don't miss another Article
Subscribe to our blog for free and get regular updates right into your inbox.
Categories
newsletter
 HSL Mobile App


