A Complete Guide to Understanding Bollinger Bands
There are various technical analysis tools and indicators in the financial markets that help traders make better trading decisions. A trader can get easy access to multiple indicators like moving averages, Relative Strength Index (RSI) and volume indicators. A trading strategy can be formulated using one or a combination of several indicators. In this article, we will look at a popular indicator known as Bollinger Bands.
Bollinger Bands
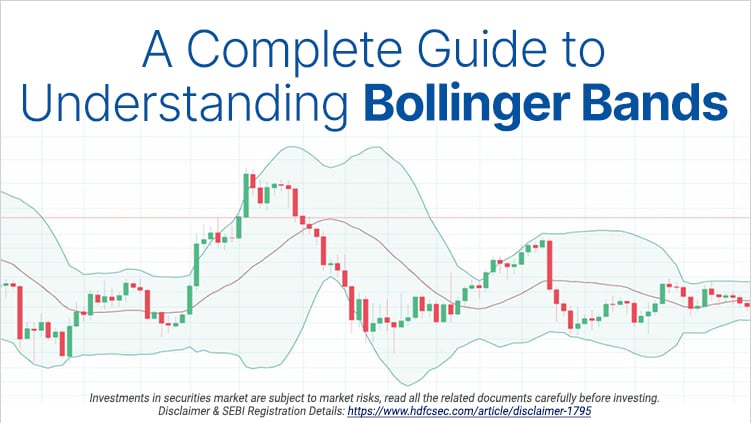
Bollinger Bands are a type of technical indicator created by John Bollinger in the 1980s that show trading ranges on a price chart. It is a price envelope created by plotting two bands around a moving average. Usually, a 20-day simple moving average (SMA) here. The upper price band is plotted two standard deviations above the SMA. The lower price band is plotted at two standard deviations below the SMA.
The standard deviation helps to take into account the volatility of the stock in a given time period. Traders use Bollinger Bands to identify overbought and oversold conditions, as well as potential breakouts.
How to interpret Bollinger Bands?
The primary function of Bollinger Bands is to indicate if a stock is at an overbought level or oversold level. If the stock’s price is closer to the upper band, the stock is considered overbought. Similarly, if the stock’s price is closer to the lower band, it is said to be oversold.
If the upper and lower Bollinger Bands contract and move closer to the SMA, the bands become narrow. Narrow Bollinger Bands indicate that there is a lack of volatility in the market. On the other hand, if the Bollinger Bands widen, the prices tend to be volatile.
How to trade using Bollinger Bands?
Although Bollinger Bands do not give exact trading signals, a Bollinger Band trading strategy can prove to be helpful in taking trades by indicating if the market is overbought or oversold.
The Bollinger Band can help a trader buy at cheap levels and sell at a high price. The Bollinger Band indicator alone cannot give a proper trading signal therefore, considering certain factors can help in entering a trade.
If the price of a stock is at the lower Bollinger Band;
- A trader should identify the overall trend of the stock.
- Look for any price action like a reversal candlestick pattern.
- Additional indicators can be used in confluence to get further confirmation.
A trader should enter a long trade after considering the above factors. The same factors can be considered for short selling if the price touches the higher Bollinger Band.
In the case when Bollinger Bands contract, a trader should wait for the price breakout and identify the direction of the trend before entering a trade.
These are a few ways in which a trader can use Bollinger Bands but there can be several Bollinger Band strategies which help a trader identify zones and enter trades.
Related Posts
Don't miss another Article
Subscribe to our blog for free and get regular updates right into your inbox.
Categories
newsletter
 HSL Mobile App


