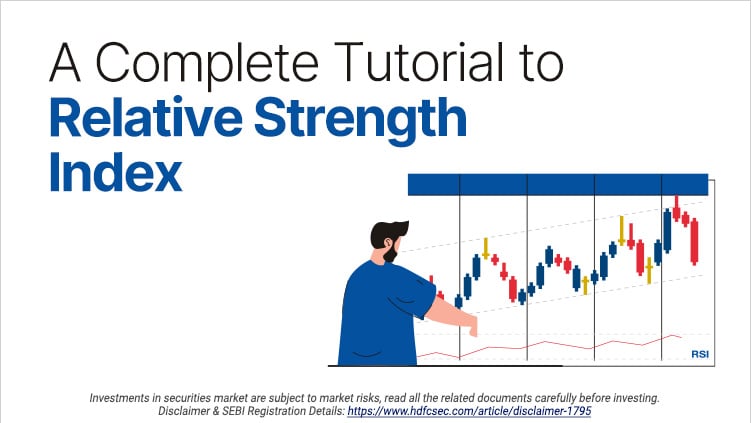
A Complete Tutorial to Relative Strength Index (RSI)
Traders have a variety of technical indicators available to them for market analysis. Many market participants like to experiment with these indicators and find the one which fits their strategy the best. Although an indicator cannot guarantee success always, some indicators have a relatively accurate track record. One of the most popular indicators that many traders use is known as the Relative Strength Index (RSI). The RSI indicator is can be a powerful tool for detecting market trends and identify overbought and oversold levels.
RSI Indicator
Before learning how to use the indicator, it is important for us to know what the relative strength index is. The RSI indicator was developed by J. Welles Wilder Jr in 1978. The relative strength index indicator falls under the category of momentum indicators. As the name suggests, the RSI indicator helps traders and investors understand the speed and momentum with which the price of a security moves.
The primary function of the relative strength index is to identify if a security is overbought or oversold. Furthermore, it can also help in identifying trend reversals and price corrections.
How is RSI calculated?
The RSI formula makes use of the average gains and losses that have occurred in the security’s price over a period of time. Usually, a period of 14 is taken while calculating the formula. For example, the formula will calculate using the average gains and losses that have occurred within the past 14 days.
The RSI formula is a two-part formula.
RSI one = 100 – [100/1+Average Gain/Average Loss]
RSI two = 100 – [100/ 1+(Previous average gain x 13) + Current gain/ (Previous average loss x 13) + Current loss
The second formula can be used only after the price data from the previous 14 sessions is available. This is done in order to smoothen the indicator.
How to interpret the RSI
The RSI indicator is a momentum indicator. It oscillates between the range of zero and 100. Primarily, if the indicator is below 30, it is said that the security is undervalued or oversold, whereas if the indicator is above 70, the security is considered to be overvalued or overbought. The indicator is plotted below the price chart. The indicator can help traders and investors identify trends and trend reversals and also know overbought and oversold zones.
Traders can use divergences between the price and the RSI indicator in order to get buy or sell signals. A divergence occurs when the price and the indicator move in opposite directions. Another important thing to note is that the overbought and oversold levels of the RSI indicator may vary during strong uptrends or downtrends.
The RSI indicator is a very helpful tool though traders and investors should not solely rely on it. It is important to consider other factors like price action, important support and resistance zones. Using the Relative Strength Index (RSI) indicator in conjunction with other indicators can help provide more confirmation to your trades.
Related Posts
Don't miss another Article
Subscribe to our blog for free and get regular updates right into your inbox.
Categories
newsletter
 HSL Mobile App


