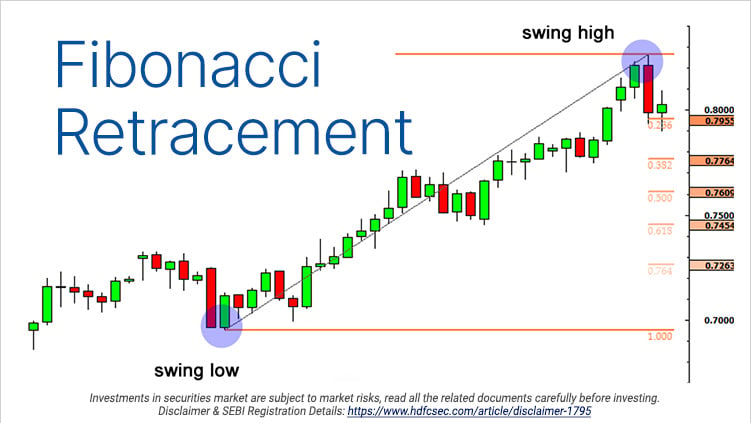
Fibonacci Retracement
HDFC securities, Head - Equity & Strategic Marketing
The world of mathematics is vast. There are several mathematical concepts with different uses. One such mathematical concept is the Fibonacci sequence. This sequence is significant because not only is it present in the world around us but can also be used by traders and investors.
Fibonacci Retracements are an exceptional technical tool used by traders to identify potential support and resistance levels in a financial market. This article will provide an overview of Fibonacci Retracement levels, including what they are and how to use Fibonacci Retracements to make more informed trading decisions.
Before we learn what is Fibonacci Retracement, we need to know what the Fibonacci sequence is.
The Fibonacci sequence is a sequence of numbers that is obtained by adding the number before it. This sequence starts from 0 and can carry on infinitely.
0, 1, 1, 2, 3, 5, 8, 13, 21, 24, 55, 89, 144, 233, 377, 610, 987…
As you can see above, the Fibonacci sequence is obtained by adding the preceding number. It is significant because when any number in the sequence is divided by the preceding number, a ratio of 1.618 is obtained. This ratio is known as the Golden Ratio.
For example:
233/144 = 1.618
377/233 = 1.618
Additionally, there are several common ratios which are obtained by dividing different numbers in the series. If a number is divided with a number one place higher, the ratio of 0.618 is obtained. Similarly, if a number is divided with a number two places higher, the ratio of 0.382 is obtained.
These ratios are known as the Fibonacci retracement levels.
Fibonacci Retracement
The Fibonacci levels are deployed by traders and investors to find out the levels where a price will retrace. When the price of a stock moves up or down, it retraces to a previous level before continuing the move. More often than not, these levels coincide with the Fibonacci retracement levels.
How to use Fibonacci retracement?
A Fibonacci retracement strategy is a forecasting strategy that can be used to predict levels until where the price of a stock will retrace. Traders use these retracement levels to identify support and resistance levels and determine entry and exit points.
If the price of a stock has run up significantly, an investor can use the Fibonacci levels to predict the retracement level and purchase the stock there. Similarly, in the case of a down move, a trader can use the Fibonacci levels to short the stock once the price retraces.
There are certain things about Fibonacci retracement levels to note.
- While using Fibonacci retracement levels, one can use indicators like Relative Strength Index (RSI) or Bollinger Bands to increase the odds of a trade.
- A trader can wait for a candlestick pattern or any price action near the Fibonacci levels before entering a trade.
- While using Fibonacci retracement levels, it is important to keep a strict stop-loss and follow risk management.
The Fibonacci retracement levels can help predict where the price will retrace. Traders can combine the Fibonacci levels with additional indicators to form a solid trading strategy.
Related Posts
Don't miss another Article
Subscribe to our blog for free and get regular updates right into your inbox.
Categories
newsletter
 HSL Mobile App


