Morning Star Pattern
Technical analysis is a method of analyzing the movements of stock prices, to predict future trends and make investment decisions. There are numerous technical strategies and indicators that traders deploy. Candlestick patterns are reliable and popular technical analysis tools used in stock market trading. They help analyse the price action of a stock or index. In this article, we will learn about one of the many candlestick patterns - the morning star pattern.
What is the morning star pattern?
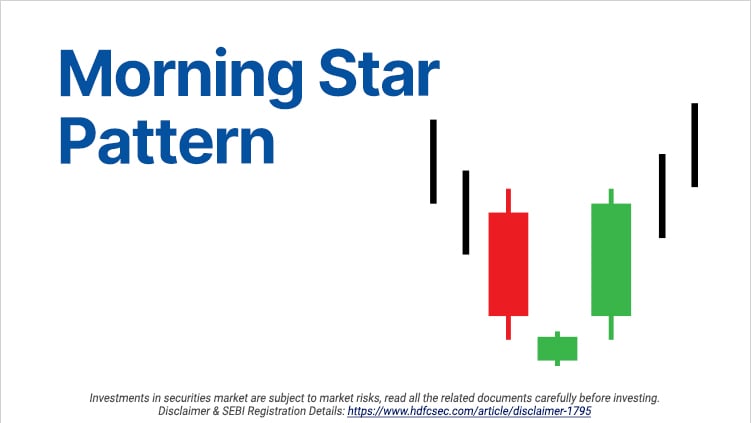
The morning star candlestick pattern is confirmed on a price chart after the formation of three candlesticks. This pattern is often used to identify potential trend reversals a downtrend in the price of a particular stock or security. It helps detect potential buying opportunities.
The morning star candlestick is formed at the end of a downtrend. As discussed, earlier it is a triple candlestick pattern.
- The first candlestick will be a bearish candle indicating high selling pressure. Such candles are common in a downtrend or bearish market.
- The second candle is a small bearish candle that is formed after a gap-down opening. A gap-down opening refers to the price opening lower than the previous day’s trading range. The second candle is usually a Doji candle which indicates that the market is indecisive.
- If the third candle is a gap-up candle, then the morning star pattern is confirmed.
Significance of the Morning Star Pattern
The morning star candlestick pattern signals a trend reversal. It usually forms at the end of a long downtrend or a bearish market.
The first bearish candle in the pattern indicates that the bears still have control, and the price forms a new low. The second candle opens a gap-down which further gives confirms that the price may fall. Although in the morning star candlestick pattern, the price does not fall further. If this candle forms near an important support level, there might buy some buying seen.
The third candle confirms the morning star candlestick pattern. After a gap-up opening, the price moves higher as the bears might close their short positions and more bulls enter the market which indicates that the trend has reversed.
How to trade the morning star candlestick pattern
Although a morning star candlestick pattern can indicate there is a trend reversal, it is beneficial to use other indicators to get a further confirmation for your trades.
A trader can use the RSI indicator which helps in knowing the momentum of the price. If the RSI indicator crosses 30 while the morning star pattern is formed, a trader can enter a long position.
Traders can also use a Bollinger Band to get confirmation about a trade. If the second candlestick forms below the lower Bollinger Band and if the third candlestick is above the lower Bollinger Band, then a morning star pattern gets further confirmation.
Candlestick patterns can be a helpful tool for traders and investors to analyse the price and enter or exit trades. Since no strategy or indicator can work every time, one should follow strict risk-management principles while trading.
Related Posts
Don't miss another Article
Subscribe to our blog for free and get regular updates right into your inbox.
Categories
newsletter
 HSL Mobile App


