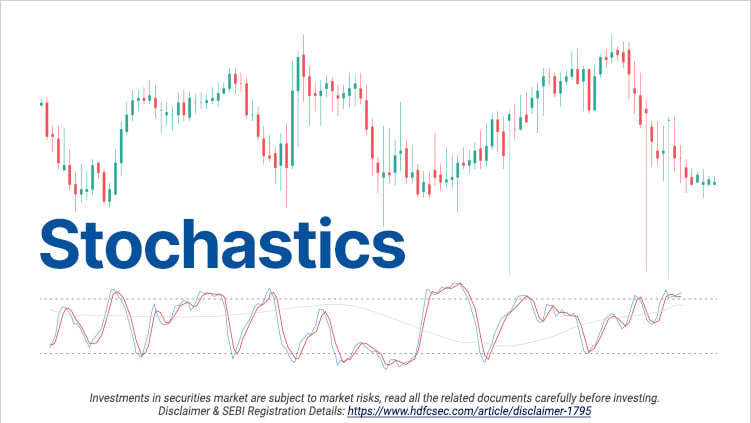
Stochastics
Traders use multiple technical indicators to identify potential market movements. These indicators help analyze trends on the price charts, anticipate changes in the stock prices, and make predictions about future direction.
Technical indicators are of two types – Overlays and Oscillators. Overlays are plotted on top of the prices on a chart. Oscillators are plotted above or below a price chart and oscillate between a local minimum and maximum. In this article, we will learn about Stochastic Oscillator, an indicator that has been around for a while and has a relatively accurate track record.
What is the Stochastic Oscillator?
George Lane developed the Stochastic Oscillator in the 1950s. This indicator is a type of momentum oscillator used to identify when a stock is in an overbought zone or oversold zone. Stochastic measures the relationship between the closing price and the price range of high and low prices of a particular stock over a period of time.
Many traders and investors prefer using the Stochastic Indicator because it is easy to understand and has a track record of providing accurate signals.
Formula of the Stochastic Oscillator
The basic principle of Stochastics is that the closing price of a stock in an uptrend will be near the day’s high and in the case of a stock being in a downtrend, the closing price of the stock will be near the day’s low. The price range and the closing price are two important factors in understanding the Stochastic Indicator.
When it comes to selecting the time period of the price data, 14 is the most common period in different timeframes like 14 days, weeks or months.
The Stochastic Oscillator has 2 lines known as the K line and the D line.
%K = 100 x CP- L14/H14-L14
In the above formula,
CP = Closing price of the most recent session
L14 = The lowest traded price in the last 14 trading sessions
H14 = The highest traded price in the last 14 trading sessions
D = 100(H3/L3)
H3 = The highest traded price in the last 3 trading sessions
L3 = The lowest traded price in the last 3 trading sessions
Trading with the Stochastic Indicator
The Stochastic Oscillator moves within a range of 0-100. If the K and D lines are above 80, the stock price is said to be in overbought territory whereas if the lines are below 20, the stock price is considered oversold.
Traders should focus on the D line since it is the faster-moving line of the two. If this line is above 80, it can be taken as a signal to sell. Similarly, if the line is below 20, It can be considered as a buy signal. A divergence occurs when the price and the indicator move in opposite directions. Traders can use divergences and other indicators in order to formulate a Stochastic Oscillator Strategy.
Any trader or investor should not solely rely on a single indicator and it is important to consider several other factors and manage your risk while trading or investing in stock market .
Related Posts
Don't miss another Article
Subscribe to our blog for free and get regular updates right into your inbox.
Categories
newsletter
 HSL Mobile App


